Confronting racial inequities in charlotte’s transportation and land use
It’s no secret that past and present racism and racial bias have led to profound inequities in quality of life for many Charlotteans. Our Program Director Meg Fencil attended the Facing Race conference in Detroit last week. Here are just a few of the concepts that we plan to incorporate into our work. We strive to do all of our work through a lens of racial equity and recognize that it’s a learning process. Facing Race was a fantastic opportunity to conceptually center our work in racial justice and equity.

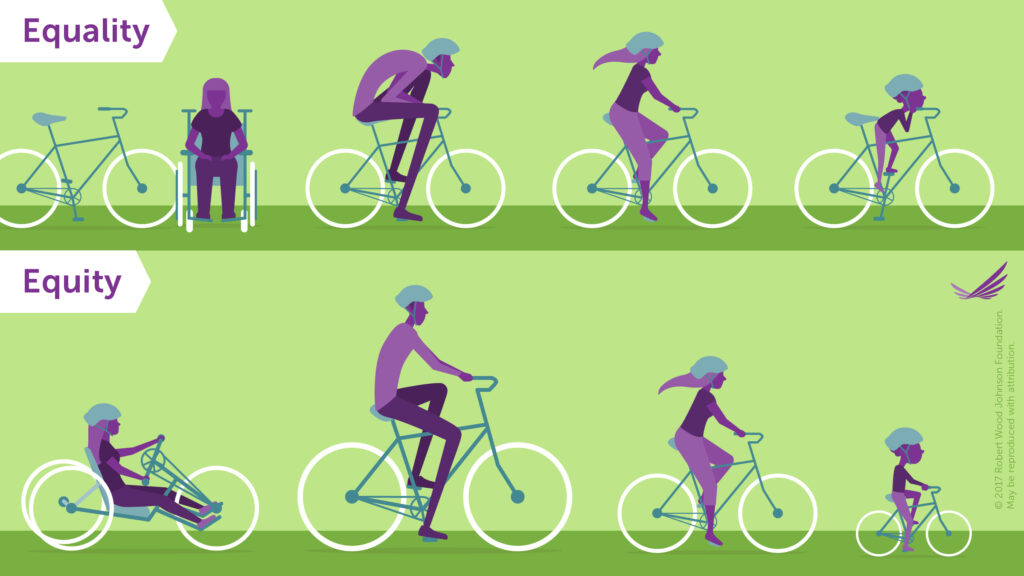
Equity bicycle graphic, English, green background.
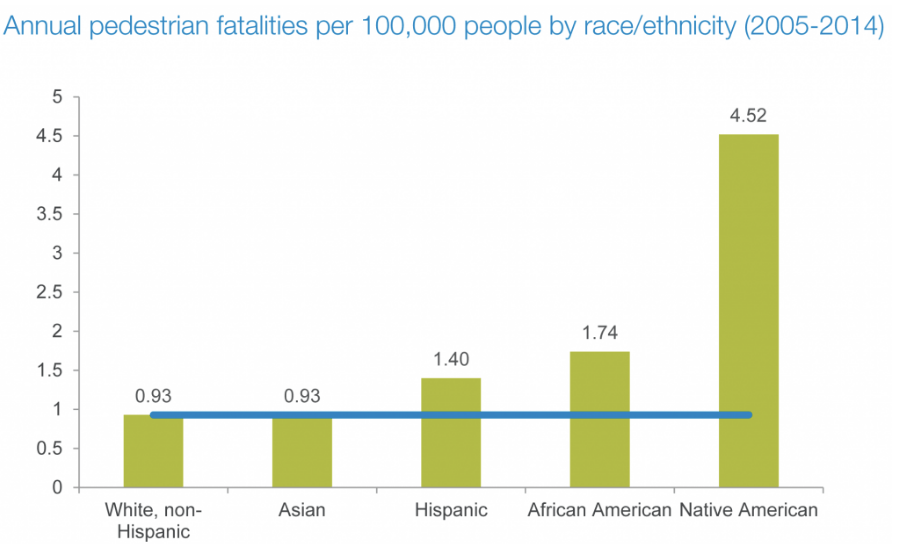
Traffic fatalities aren’t colorblind.
Across the country and in Charlotte, young black men are killed and seriously injured in pedestrian crashes at a disproportionately higher rate than whites. The Charlotte Department of Transportation (CDOT)’s Vision Zero program acknowledges this safety inequity and is working to address gaps in data and implementation in order to eliminate traffic fatalities and serious injuries by 2030.

Nationwide pedestrian fatality rates are much higher for people of color. (image: Smart Growth America)
Geography, race, and income can’t be ignored.
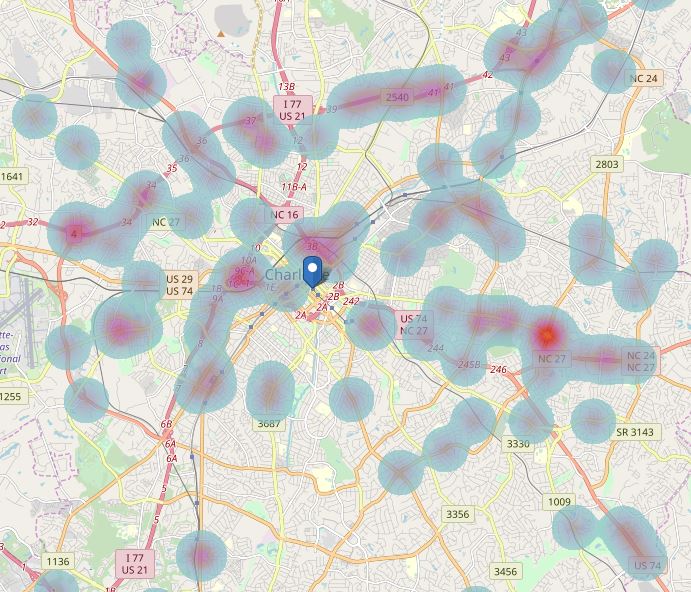
Adam Rhew’s coverage of the relationship between household income and geographic patterns of pedestrian fatalities drew attention to this link. Here’s a heat map of pedestrian fatalities in Charlotte. Notice how fatality rates are highest in Charlotte’s “crescent” that runs from the west to the north to the east. This area is predominantly non-white and household incomes are lower. Fatalities are lowest in Charlotte’s predominantly white “wedge” to the south. Safe pedestrian infrastructure is needed in all areas of Charlotte, but the inequity in safety is highest in the crescent.

Interactive heat map of Charlotte’s pedestrian fatalities (image: Smart Growth America).
Click here, then click the “Interactive Maps” tab.
Words matter.
“Health (or safety) disparities” or “health (or safety) inequities“? They don’t have the same meaning. Lack of clarity about how these terms are used can result in community funding and resources being misdirected.
A “disparity” is simply a difference or variation, without specification about its cause or the factors that contributed to it. An “inequity” is a difference that is “avoidable, unnecessary, and unjust” (definition by Margaret Whitehead). Not all disparities are inequities. Some outcomes are to be expected, such as higher rates of arthritis in older adults than in young adults, or more repetitive motion injuries among factory workers than clerical workers.
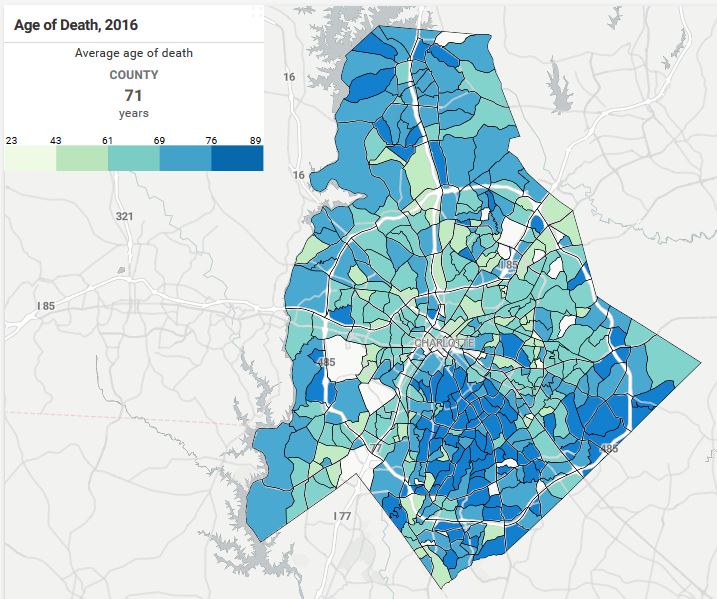
Here’s a local example of inequity. There’s huge difference in average age at death across Mecklenburg County. There’s no logical reason that the basic differences in the physical geography of the county would result in such wild variation in lifespan! The pattern in lower age at death closely mirror’s Mecklenburg County’s non-white population, which in turn closely mirrors lower household income. Another example of an inequity is shown in the map above of pedestrian fatalities mirroring household income and race.

Map of age at death in Mecklenburg County (image: Mecklenburg Quality of Life Explorer)
We invite you to check out the Mecklenburg Quality of Life Explorer’s interactive maps to learn more about patterns of race, income, and inequities. It’s one of the most comprehensive and user-friendly neighborhood-level data sources in the country.
Sustain Charlotte thanks the Z. Smith Reynolds Foundation for supporting our work to advance racial equity and their support to attend the Facing Race conference.
Thanks for reading!
As a nonprofit, community support is essential for us to keep doing what we do — including providing free articles like this. If you found this article helpful, please consider supporting Sustain Charlotte.
Want to stay in the loop? Subscribe to our weekly newsletter and follow us on Instagram, Facebook, and Twitter.
